Rocío Del Carmen

To build stronger customer relationships, businesses need to understand users across the entire journey. Mixpanel makes that possible by answering key questions in one place—but only if the data is in good shape.
I led the design from research to launch to reduce friction in our core product. My focus was on Content Creators—those setting up reports for their teams. By making it easier to get rich insights from existing data, I helped businesses get more value from Mixpanel without extra cost.
This solution not only improved the user experience but also reinforced Mixpanel’s position as a flexible and trustworthy analytics platform.
Collecting data is easy—getting insight isn’t.
In small teams, tracking can adapt quickly. But at scale, data collection (engineering) and data use (product, marketing) split, slowing analysis and decision-making. Big companies add data teams to bridge the gap—but that adds overhead for everyday needs.
So we asked: What if every Content Creator (Product Manager, Analyst, Marketer) could shape their data without waiting on others?
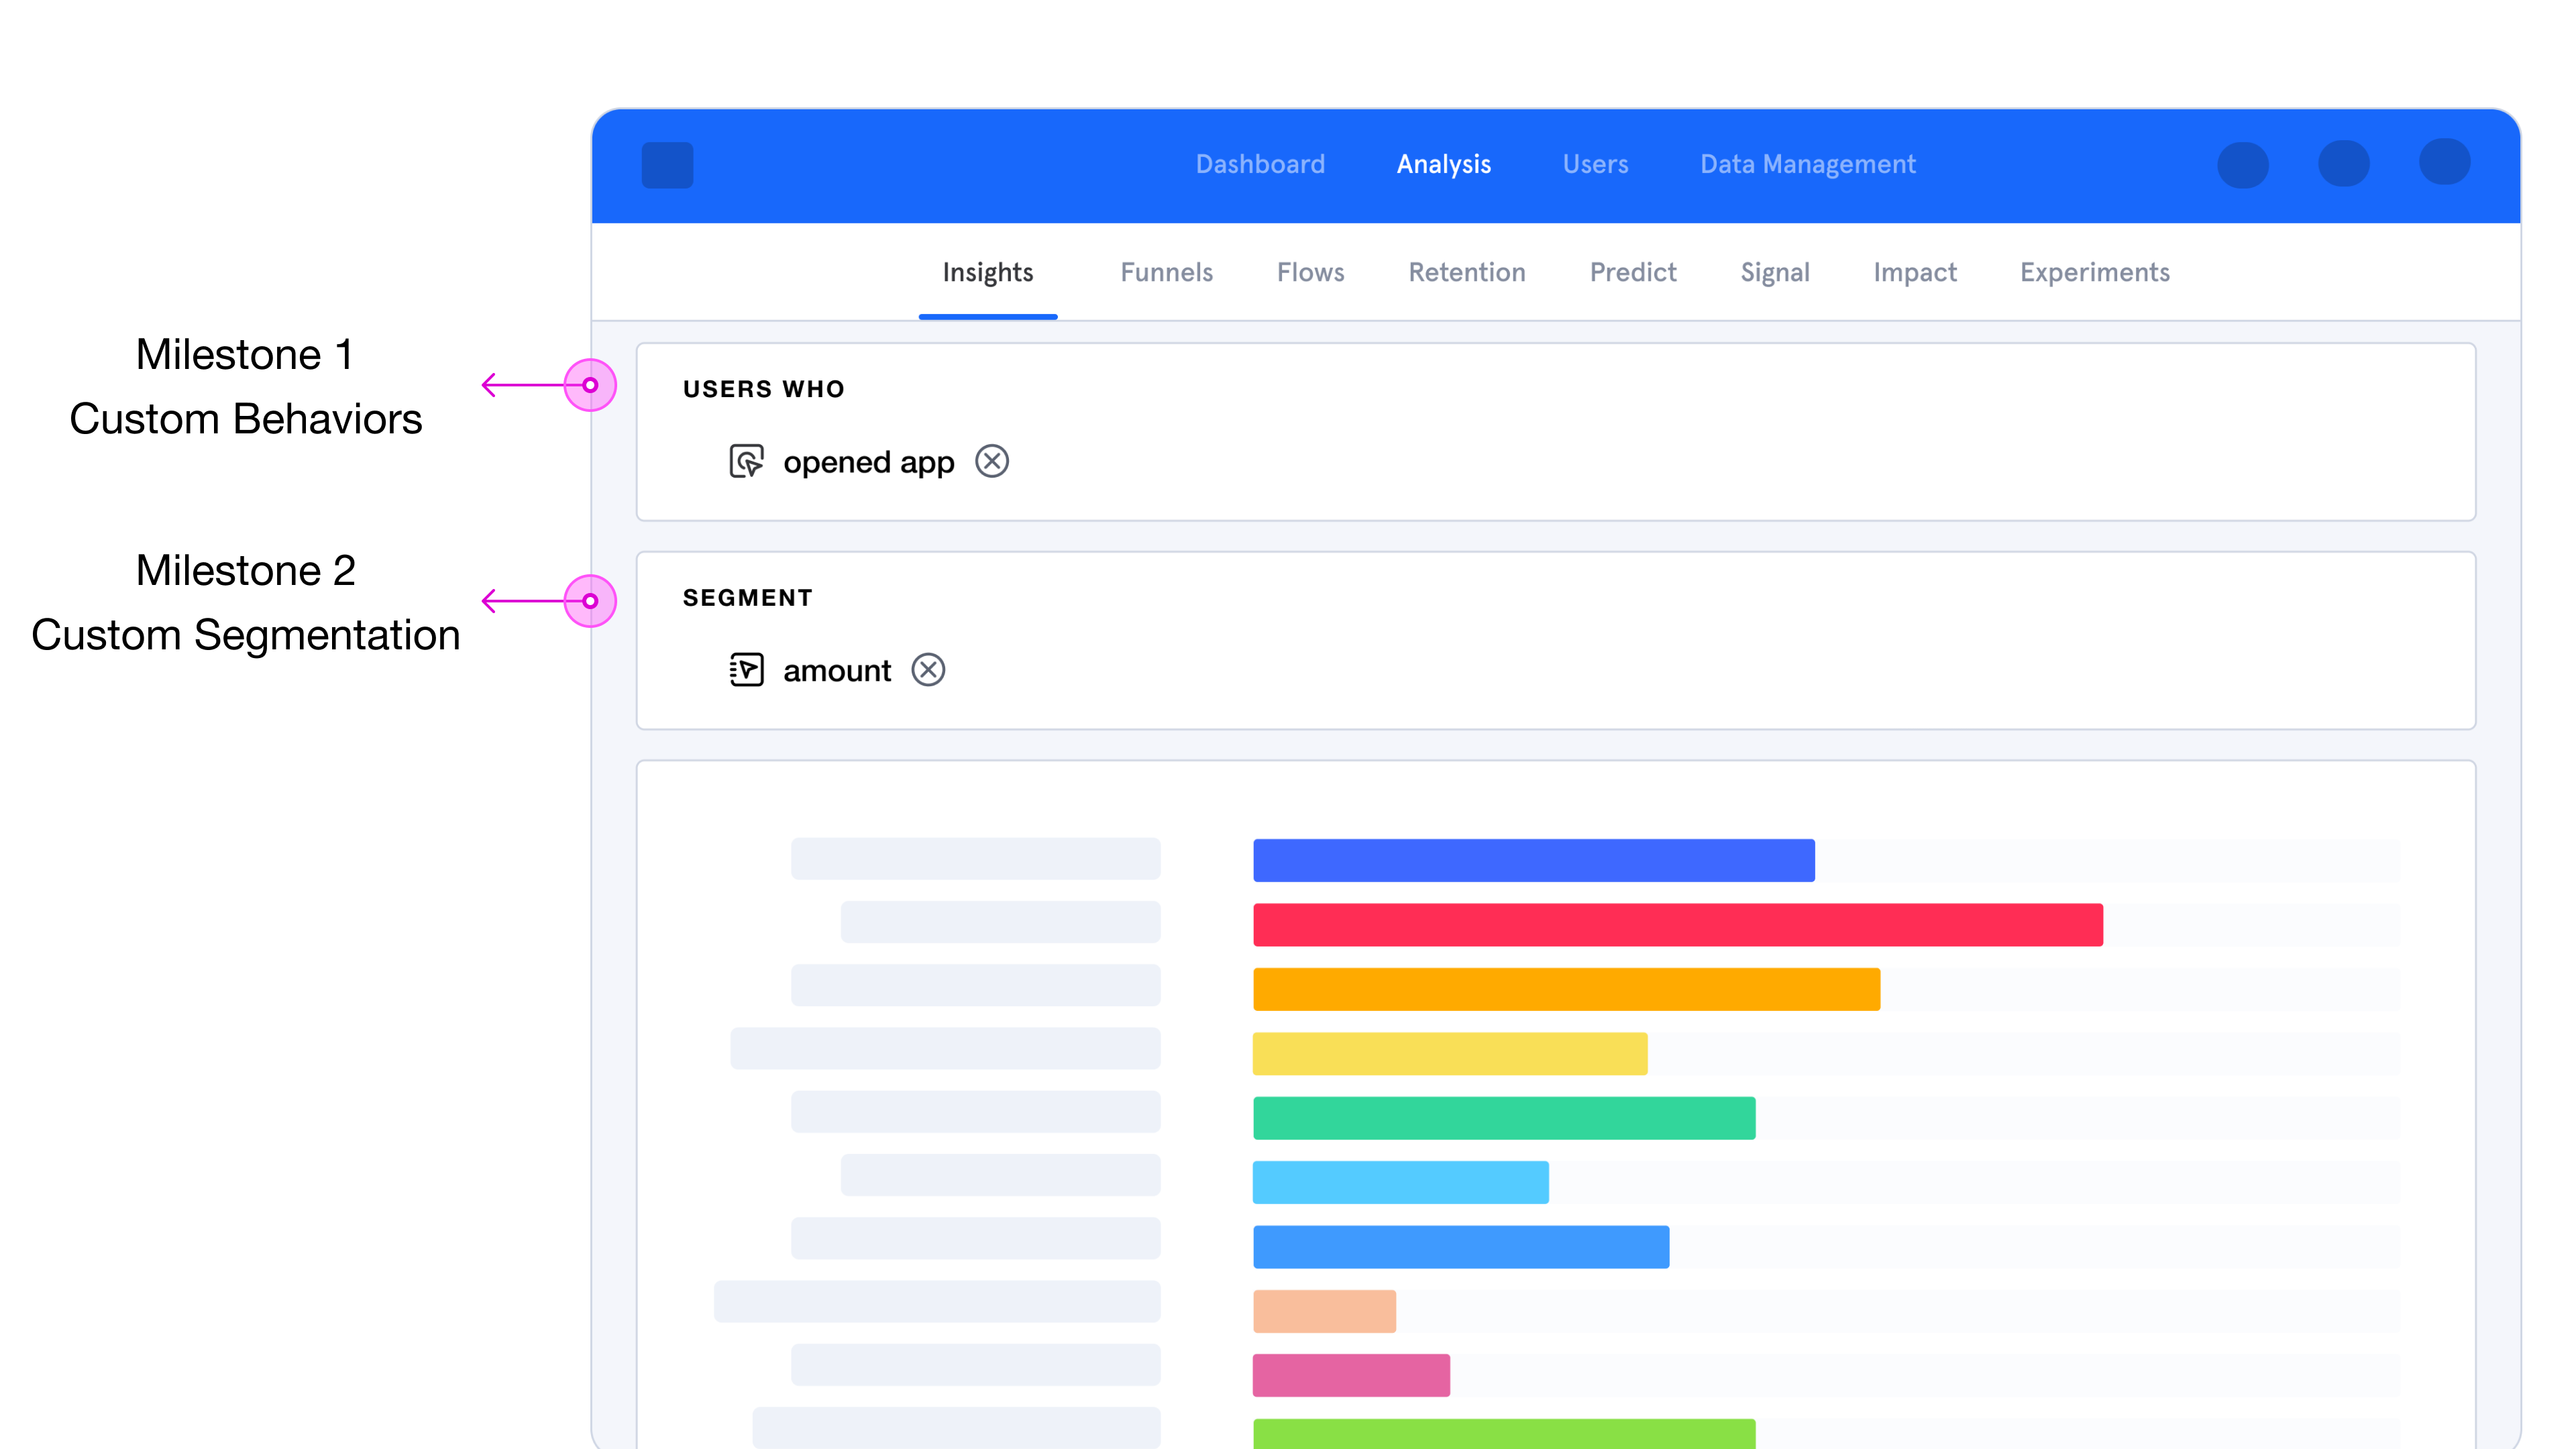
For instance, instead of raw timestamps, imagine seeing users as “early,” “on-time,” or “late.” Custom segments like these make insights clearer, actions faster, and collaboration smoother.


During discovery, I uncovered 2 key friction points:
As a result, Content Creators are slowed down, unable to quickly deliver meaningful Insights, Flows, Funnels and Retention reports their teams need to make informed decisions.
I contributed to product strategy by helping my team:
This ensured our roadmap was both user-centered and strategically focused on delivering business value.


To help Content Creators answer complex questions about user behavior, I ran design sessions with product managers to learn what an ideal analysis workflow looks like. They needed more advanced operations to aggregate and group.
In testing, Direction A aligned best with how Content Creators think—they value efficiency and see the query as the central place to ask all product questions.


With behavior definition now built into the query, I hit a few fun design puzzles:
To improve clarity, I tested several iterations. The trickiest part? Balancing interaction between the question (query) and the answer (chart).
You might ask, “Why not go vertical and spotlight the chart?” We’re headed there—but not this quarter. For now, I worked within the horizontal layout product constraints.

Asking a behavioral question is just half the battle—visualizing it clearly is the other.
Content Creators asked: Am I looking at one event? One segment? People?
So I tested color palettes to match the new mental model.Turns out, single-color schemes didn’t work across chart types like lines or stacks.
The winner? Categorical colors—clear, flexible and made everything click especially in Dashboards, where Consumers needed to identify patterns quickly.


Content Creators loved the flexibility to ask more nuanced questions without having to wait days for their development teams to send extra data to Mixpanel!
But the list operations was very long even when split across two controls. In the next iterations, I focused on simplifying this to make it more intuitive and comprehensible. I went forward with an extended menu with visual cues on hover to minimize clutter.


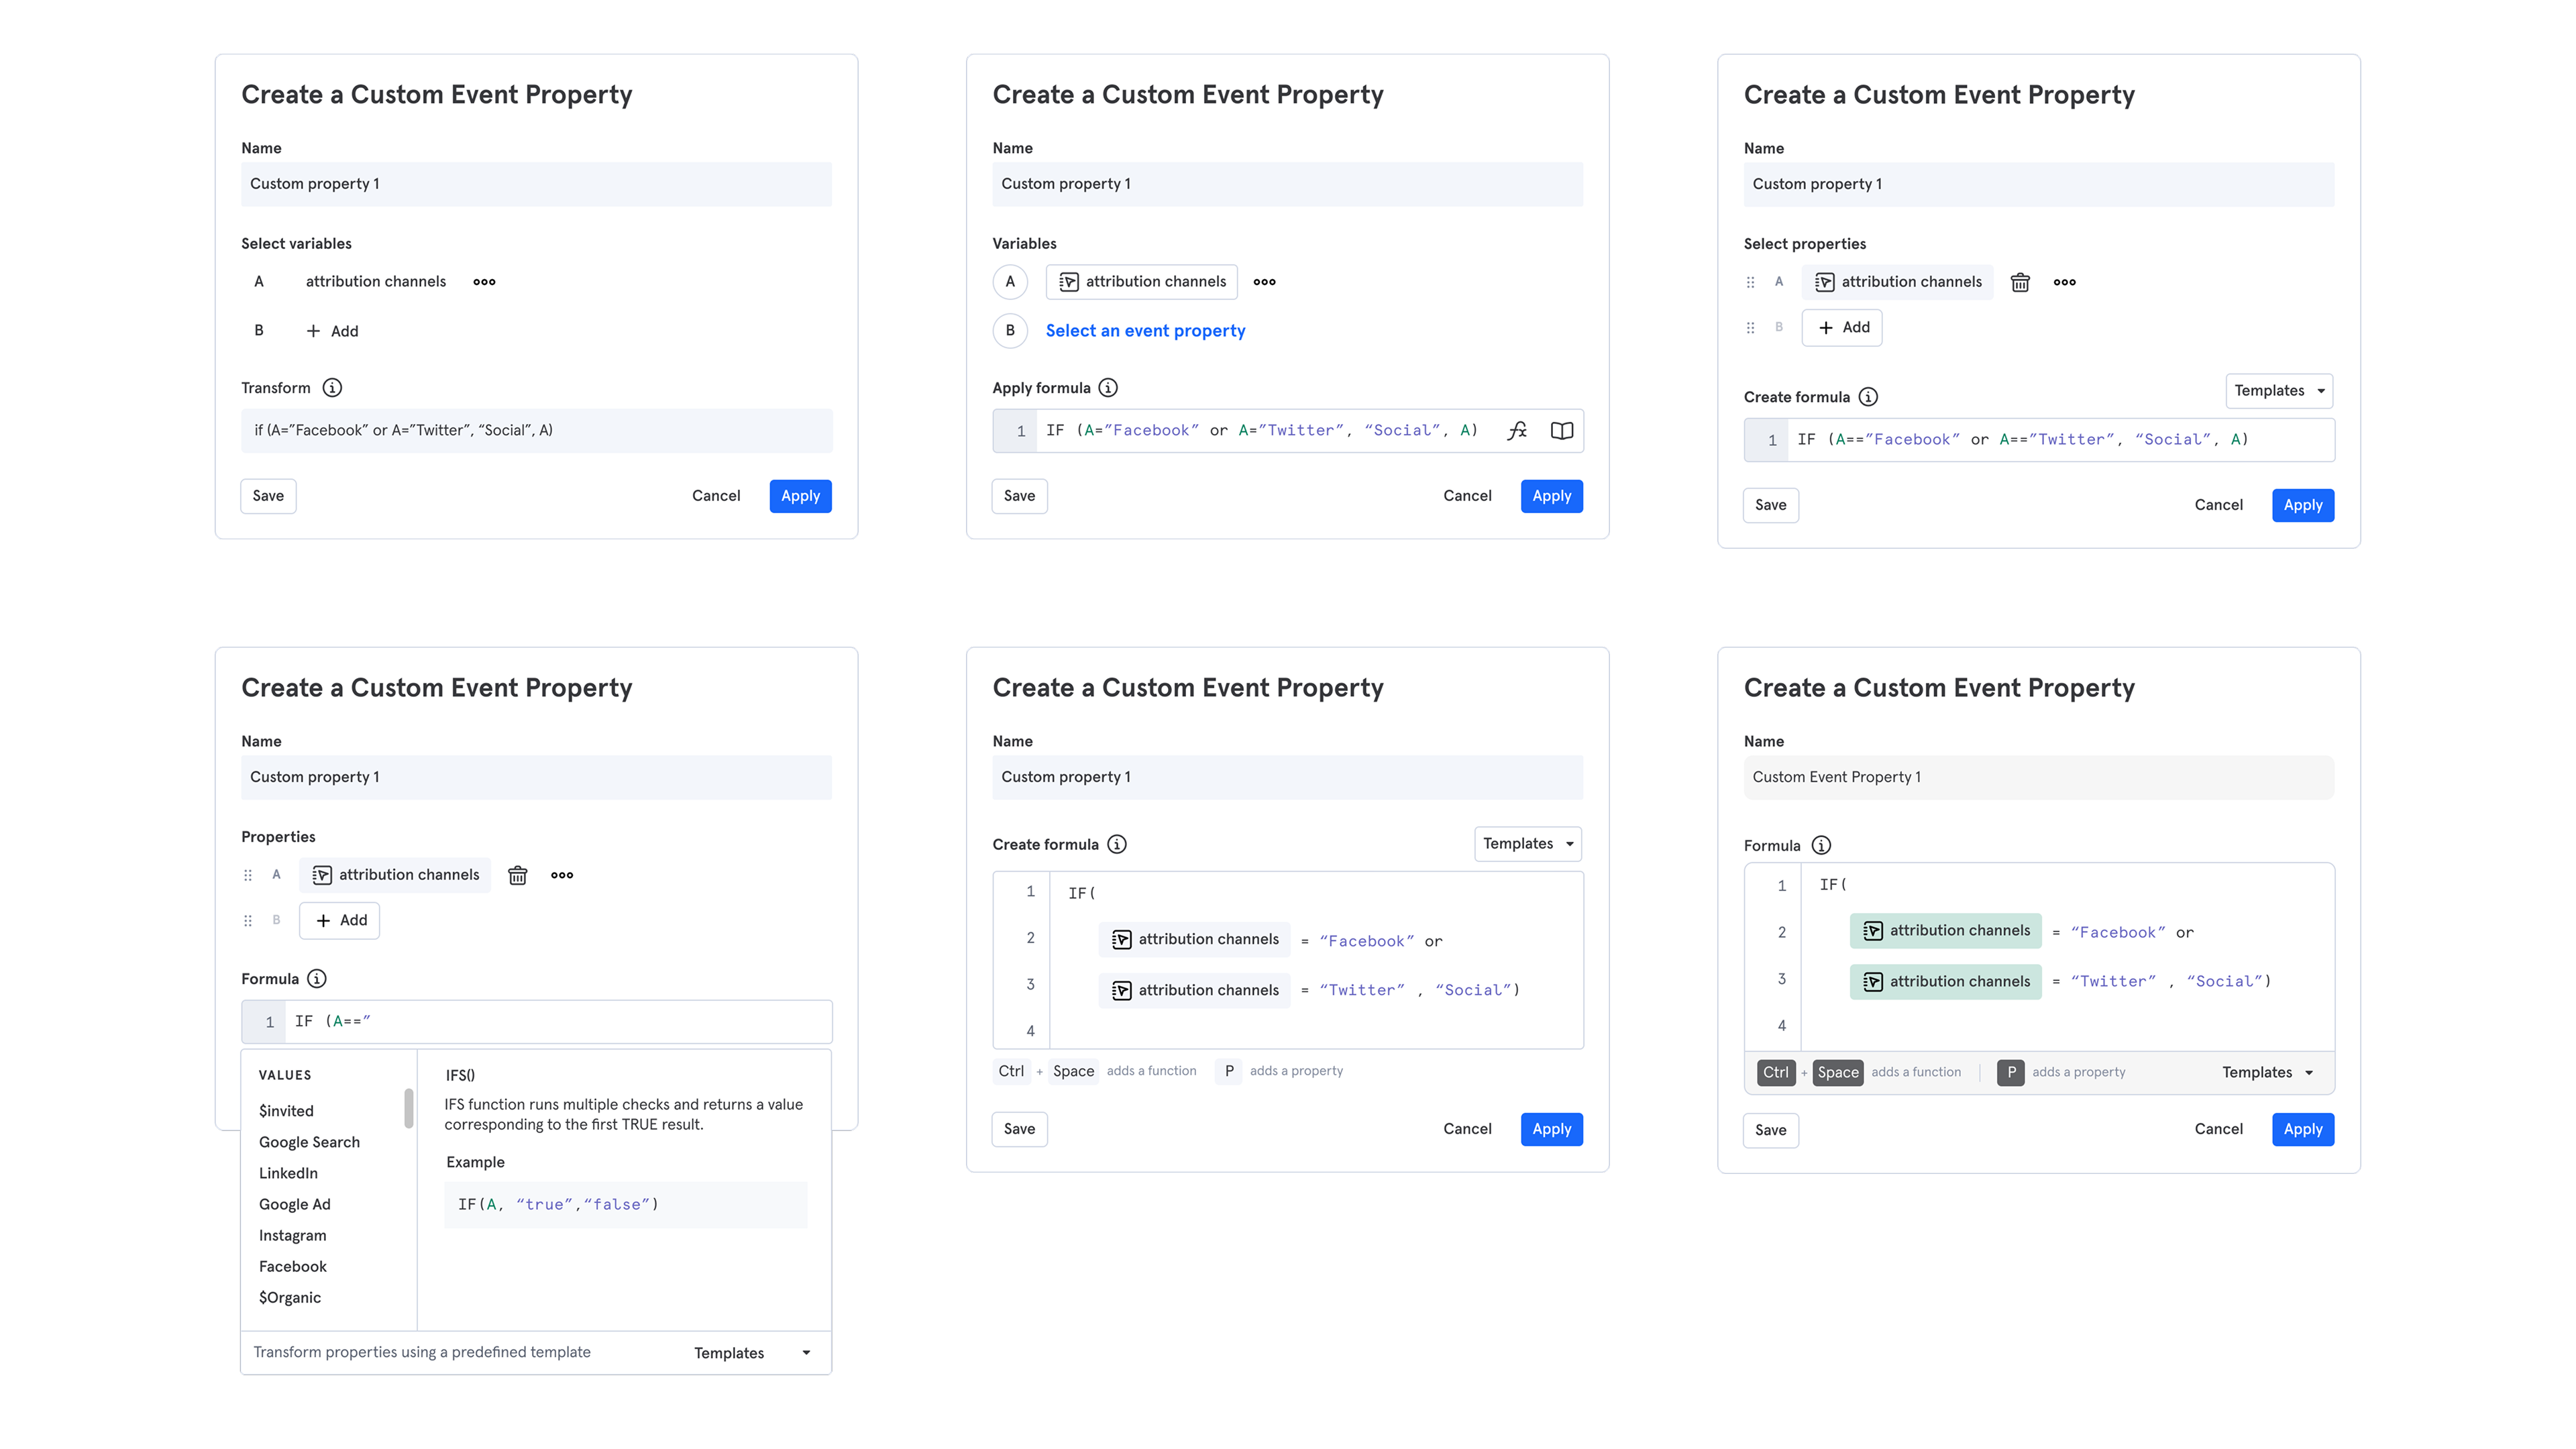
Next, I tested 2 ways to help Content Creators build custom segments:
While the guided approach was friendlier for beginners, it lacked flexibility. Since Content Creators were data-savvy (often with SQL skills), I went with freeform for maximum power and control. With freeform as the chosen direction, I tested and refined approaches to help Content Creators express transformations naturally—prioritizing clarity, ease of use and creative flow.


I designed a visibility system that empowered Content Creators to control who sees their custom content—ensuring each team accessed only what was relevant to them to build trust and reduce content fatigue.
I also explored ways to surface custom content within Mixpanel’s Data Management library to support implementers in managing data integrity and billing conversations. By integrating it into existing filters—instead of adding a new category for every content type—I ensured visibility without disrupting Content Creators’ workflows across multiple content types.


Custom behaviors and segmentation made Mixpanel reports way more valuable—teams can now explore engagement, retention, and user journeys using language that actually makes sense to them. Finally, analysis feels like it belongs to the whole company, not just the data team.


I teamed up with Brand to showcase the value of the new workflow on our Analysis page and worked with Support to highlight real customer questions Mixpanel now answers—building clarity and trust beyond the product.


